Case Study - an example of how the OMS methodology works
The following case study is based on a solved, real-life problem in a manufacturing company. The example is a fragment of the whole.
Problem: Unsatisfactory performance (low profit in relation to inputs)
Challenge: Is it possible to save PLN 1,000,000 per year in the production process without reducing efficiency?
In the case presented, the introduction of changes made it possible to achieve savings at the assumed level. The solutions proposed by BPI and applied in the company made it possible for one employee to work instead of two. It was possible to reduce the number of employees but we recommend that the employee should not be dismissed but transferred to a department where vacancies exist. Savings resulting from the presented substitutions amount to PLN 60,000, PLN 120,000 and PLN 180,000 per year for work on 1, 2 or 3 shifts respectively. At the same time, this case study shows a fragment of a larger production - only three positions/machines. Assuming that the production is composed of min. Assuming that production consists of at least 15 stands/machines, it will be possible to introduce changes and improvements resulting in savings of PLN 1,000,000 per year or more. per year or more. The presented example - a cut-out, is based on real production, in which the proposed savings exceed 1,000,000 PLN per year. Simulations were carried out using LogABS software, of which we are also a distributor.
Case study of improvement implementation, savings in production.
-
First step
- Collection of data consisting of several days of observation of production with its active measurement (times of individual activities, detection of apparent activities).
- We present the measurement of 3 workstations: M2, L1, M1 (part of a larger factory).
-
Simulation 1
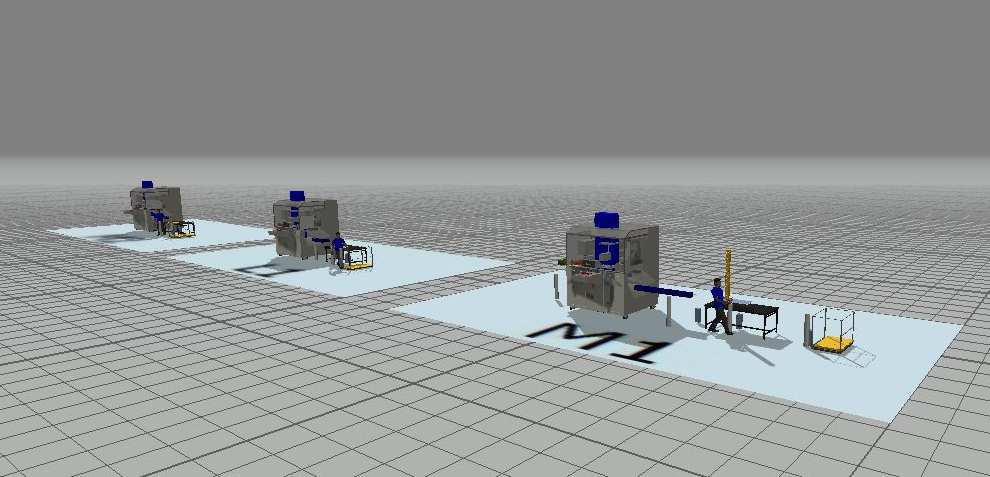
- Simulation 1 was based on real measurements performed.
- Video of simulation 1: https://youtu.be/5B0JQ28ysZs
-
Screenshot of the simulation:
-
Based on simulation 1, we obtained the following data. In the graph we can see the involvement of machines and workers in the activities:
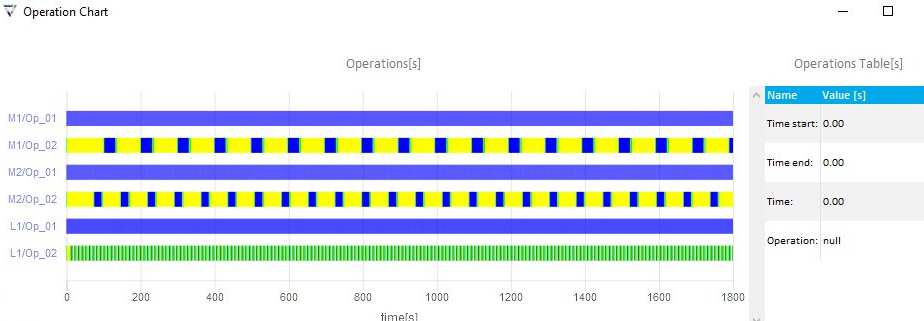
- Conclusion from simulation 1: the workers of machines M1 and M2 have a reserve of working time (yellow label).
-
Simulation assumptions 2 - can one worker operate both machines M1 and M2?
- The work system of the workers has been changed.
- Video of simulation 2: https://youtu.be/Y1cjVBFaO6U
-
Screenshot of the results:
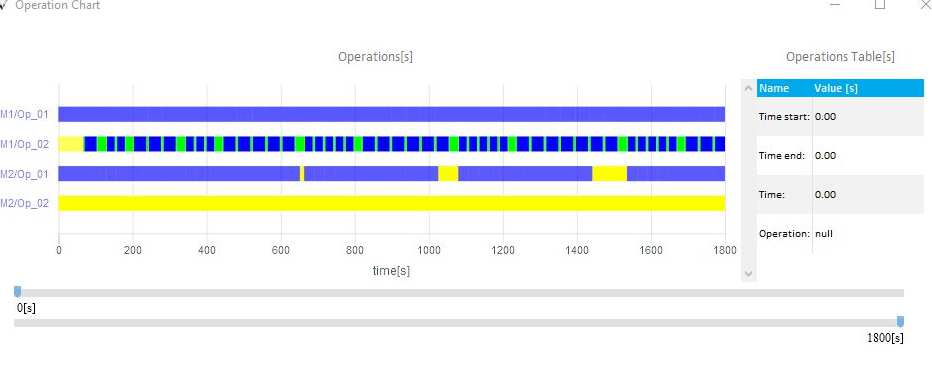
- Conclusion from simulation 2: worker M2 is not working (is switched off), worker M1 is working intensively. Unfortunately, his work causes machine M2 to have downtime (in yellow), i.e., it has to wait for worker M1 to approach. In this situation, however, there is lower productivity (at lower costs). However, further optimization can be made - simulation 3.
-
Proposed simulation 3 - reorganization.
-
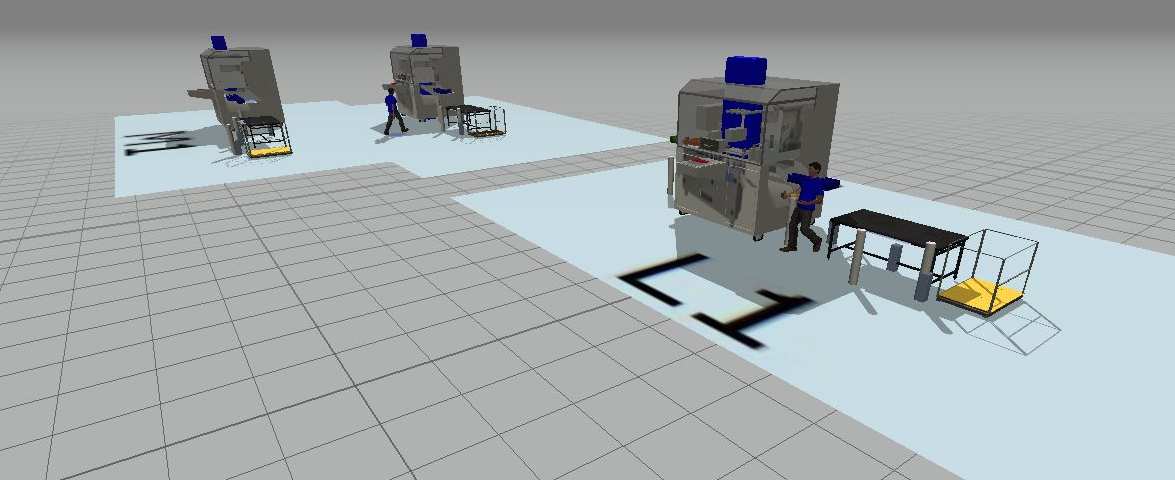
Screenshot of machine repositioning - machines M1 and M2 were placed side by side:
- Video of simulation 3: https://youtu.be/M6UGD4yYG_M
-
Screenshot of results from simulation 3:
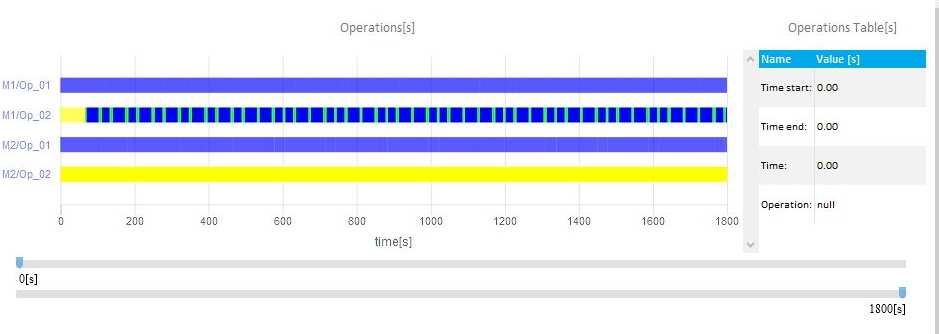
- Conclusions from simulation 3: The repositioning of the machines allows one worker to work instead of two. This knowledge is obtained before the machines are switched.
-
This case study presents one possible improvement of which Business, Progress, Innovation has many more.